Introduction
Over the last few years I've been experiencing conflicts between pure agile development and the need for budgeting. At SciSpike we do everything agile and it works for us. We have a good idea of the velocity of our teams and can often be very accurate in our estimates.Often, when working on client projects, we don't have metrics or heuristics that we can use to help us with the estimation. We may also be working with unknown resources (either they outsource to 3rd parties or the project has yet to be staffed). In extreme cases, we may be also be asked to estimate before knowing what technology to use.
Eventually, no matter the uncertainty, we will be asked this question:
One answer that is not acceptable is simply: I don't know, no matter how true it is!How much is this going to cost and when will it be done?
In this article I'll discuss how we may better communicate our estimates and the inherent uncertainty within the estimates.
Why don't I know how long it will take?
You may ask: You have 30 years of experience building software and you still can not estimate how long it would take to build something? Perhaps I'm in the wrong profession?Published research (Sackman, Erickson, and Grant, 1968; Curtis 1981; Curtis 1985; Mills, 1983; DeMarco and Lister, 1985; Card, 1987; Valett and McGarry, 1989; Oram and Wilson, 2011) establishes a difference in productivity between the most and least productive software teams of 10X (that is, the most productive team is 10 times more effective than the least productive team).
I know the 10X have been questioned. For example, in [Boehm 81] , the research originally showed an uncertainty of ~4, but in later writing (Boehm, 00) his estimates went up to near 6. I can see that the factor of 6 may be more accurate in some places (particularly when you average out more predictable tasks, such as: deployment, maintenance, training, etc.). Having said that, I have also been privy to some research performed by one of our clients where the difference in performance was measured to be greater than 100X. Whether you want to use the 4X or 100X, the points of this blog are still valid.
Let's use 10X for now. Think about it for a second. Let’s say I just came off a project where I was working with the top team. I have a good idea of what it would take to build some system. I estimate it based on this experience, but it turns out I get the least productive team and my estimates are off by a factor of 10! Time to pack my stuff!
Let’s say we have the opposite experience. We worked with the slowest team, estimate the project based on this experience, the project is cancelled because of cost/time and we may have lost a great opportunity. I'll keep my job, but my stock options are not as good as they could be.
Bottom line, unless you have a stable team with an established velocity, we don't really know how fast we'll be able to develop. This is often referred to as the cone of uncertainty (in software we often call it the Boehm’s cone of uncertainty):

In addition to the uncertainty in team velocity, there is also an uncertainty in project planning:
- Did we cover all the tasks?
- Do we really know the complexity of the tasks?
The need of the business
If you are a project manager, scum master or product owner, try to put yourself in the shoes of a CFO or CEO. You have discovered a business opportunity that requires development of some new software. You know how to calculate the upside of the opportunity (I've actually have built quite a few of these evaluation models). To make a business decision that resolves whether to pursue the opportunity, you need to know:- When will the project be ready (or in other words, when can I take advantage of the opportunity)?
- How much is it going to cost to get it operational and run the system after it has become operational (contributing to the downside of the opportunity)?
Say you are the CTO or Director of Software Development. The CFO/CEO will turn to you and ask for these numbers. I recommend that you don’t use the argument: "I don’t know; we have to build it before we’ll know". You may just find yourself packing your artifacts by the end of the day.
So what’s the secret sauce?
Remember the third item in the agile manifesto?Customer collaboration over contract negotiationWhat we need is mutual collaboration. Both the upper management and the development organization have to have mutual understanding of expectation and risk. Without this understanding, the following seems to reoccur in the software organizations I’ve studied:
- The C-Level is dominant. They will require the estimates and keep the responsible estimators feet to the fire.
- The estimators use pessimistic numbers to ensure their carrier is not in any danger (we’ve seen by factors of 4-10).
- Opportunities are sometimes lost because the cost of the project was overestimated.
- If the project starts, the budget will be used (Parkinson’s Law) and money is wasted.
How to express uncertainty?
I suggest that the estimate should be a graph rather than a number. The graph should show cost/time curve based on probabilities. I often hear project managers say, it will take 6 months and cost $2 million even before having a team or an established architecture. I would argue they are simply guessing. Also, anyone that is constantly 100% accurate, is most likely pessimistic, has caused loss of opportunities and is wasting money (Parkinson’s Law.) The only way to be 100% accurate is to allow a margin of error that is detrimental to the business ability to pursue opportunities.If someone that estimates have to give a number, the best ones would be wrong all the time. However, the times they are too optimistic should balance with the time they are too pessimistic.
The estimation graph
I’m not the first to suggest that estimates should be represented as a graph. In fact this was imprinted in me from my studies of practical operational research back in my university days.It seems most methods suggest that the probability curve would follow some kind of normal distribution pattern. Others argue it may follow a Parabola, Trapezoid, Parr or Rayleigh curve (Basili, 1981). I’m going to use a normal distribution curve for simplicity here (we are so imprecise here anyway, so which ever curve is better would make little difference I think).
Although the discussion of the best way to create such a curve is outside the scope of this blog article (I rather focus on the communication between project team and upper management), I’ll show you one way that you can produce such a normal distribution curve using what’s often called the “three-point estimation”. I’m actually not sure what the origin of this estimation is, but here is how you do it:
- List all the tasks that you have to perform
- For each task estimate three numbers:
- The most optimistic time (ot)
- The most realistic time (rt)
- The most pessimistic time (pt)
- Assume that the mean time can be found by the formula:
(ot + 4*rt + pt)/6 - Finally, we calculate the standard deviation using the following formula:
(pt-ot)/6
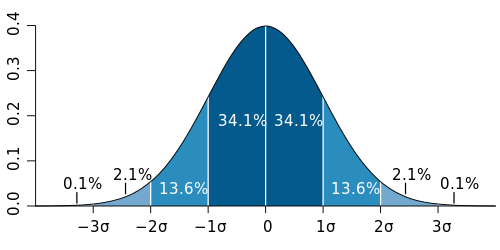
Reading and evolving the distribution curve
First, we have to be sure that we understand how to read the graph. As you probably remember, there is some science to this. Assuming we made honest estimates, we’ll have a 50% chance of exceeding the mean time formed by the curve (the peak of the curve). If you want me to have an 80% (83.6% to be accurate, but we’ll keep to round numbers) chance of beating my estimate, we should set the date to the mean (peak) + 1 standard deviation. If you want to have a 90% certainty, let’s add two times standard deviation.To get good numbers you’ll have to:
- Try to find ALL the tasks. There are several tricks for this, but to enumerate and explain them would require several blog posts and it is not the point of this article.
- Break the work into tasks that are of appropriate sizes (my suggestion is no less than 1/10th and no more than 1/100th of the total effort)
A simple example
Let’s say we have a project with 10 identified tasks (or stories, or features, or function points, or whatever you want to call them). To stay general, I’ll name the tasks A..J.Let’s assume our best guess estimates are something like:

This would suggest that we are 50% sure we’ll deliver in 44 units (say days or $1,000). We are 80% sure we can deliver in 50 units and 95% sure we can deliver in 56 units.
You may protest here (in fact you should protest here). Remember we said that the difference between the best and the worst performing team is around 10X. Since we don’t know if we get the most productive or the least productive team, we should have a difference between the optimistic and pessimistic of 10! Although I can usually do a better guess than that, let’s for sake of argument make the difference between optimistic and pessimistic 10:

Notice that even if I kept the realistic (R) and optimistic (O) constant, the numbers are now quite terrifying. Now, what we are suggesting is that our 50% chance estimate is 86 units, our 80% estimate is 124 units and that our 95% estimate is 182 units.
Even though this is still way more accurate than what the empirical research suggest, I’ve found that the numbers seem to work out OK when the project is of sufficient length to where it is possible to improve on the skills of the team during the project (either through resource swap or training).
Summary
When starting a new project in a new context, we typically don’t know what resources are required to complete the project. This does not diminish the need for business leaders to get reasonable estimates from the technologists. I suggest that we need to be more transparent in our communication of estimates and ensure that the uncertainties of the numbers are well understood and accepted by both parties. I’ve seen opportunities lost because the estimates were too pessimistic and I’ve seen well-meaning leaders being fired because the estimates were too optimistic.I suggest that the uncertainty can be communicated with a simple graph. I showed how to use a three-point estimate to produce such a graph. I would prefer to use more scientific methods, but this method is easy to use and communicate to the business. This method does not reduce the need for the estimation methods suggested by agile methodologies. Using backlogs and burndown charts is still recommended. As you learn the velocity of your team, the accuracy of the estimates will improve and as they improve, the new estimates should be presented back to the business.
References and further reading
- Basili, Victor and Beane, John. 1981 “Can the Parr Cure Help with Manpower Distribution and Resource Estimation Problems?”. Journal of Systems and Software 2, 59-69. Boehm, Barry W., and Philip N. Papaccio. 1988. "Understanding and Controlling Software Costs." IEEE Transactions on Software Engineering SE-14, no. 10 (October): 1462-77.
- Boehm, Barry, 1981. Software Engineering Economics, Boston, Mass.: Addison Wesley, 1981.
- Boehm, Barry, et al, 2000. Software Cost Estimation with Cocomo II, Boston, Mass.: Addison Wesley, 2000.
- Boehm, Barry W., T. E. Gray, and T. Seewaldt. 1984. "Prototyping Versus Specifying: A Multiproject Experiment." IEEE Transactions on Software Engineering SE-10, no. 3 (May): 290-303. Also in Jones 1986b.
- Card, David N. 1987. "A Software Technology Evaluation Program." Information and Software Technology 29, no. 6 (July/August): 291-300.
- Curtis, Bill. 1981. "Substantiating Programmer Variability." Proceedings of the IEEE 69, no. 7: 846.
- Curtis, Bill, et al. 1986. "Software Psychology: The Need for an Interdisciplinary Program." Proceedings of the IEEE 74, no. 8: 1092-1106.
- DeMarco, Tom, and Timothy Lister. 1985. "Programmer Performance and the Effects of the Workplace." Proceedings of the 8th International Conference on Software Engineering. Washington, D.C.: IEEE Computer Society Press, 268-72.
- DeMarco, Tom and Timothy Lister, 1999. Peopleware: Productive Projects and Teams, 2d Ed. New York: Dorset House, 1999.
- Mills, Harlan D. 1983. Software Productivity. Boston, Mass.: Little, Brown.
- Sackman, H., W.J. Erikson, and E. E. Grant. 1968. "Exploratory Experimental Studies Comparing Online and Offline Programming Performance." Communications of the ACM 11, no. 1 (January): 3-11.
- Sheil, B. A. 1981. "The Psychological Study of Programming," Computing Surveys, Vol. 13. No. 1, March 1981.
- Valett, J., and F. E. McGarry. 1989. "A Summary of Software Measurement Experiences in the Software Engineering Laboratory." Journal of Systems and Software 9, no. 2 (February): 137-48.
Add a comment